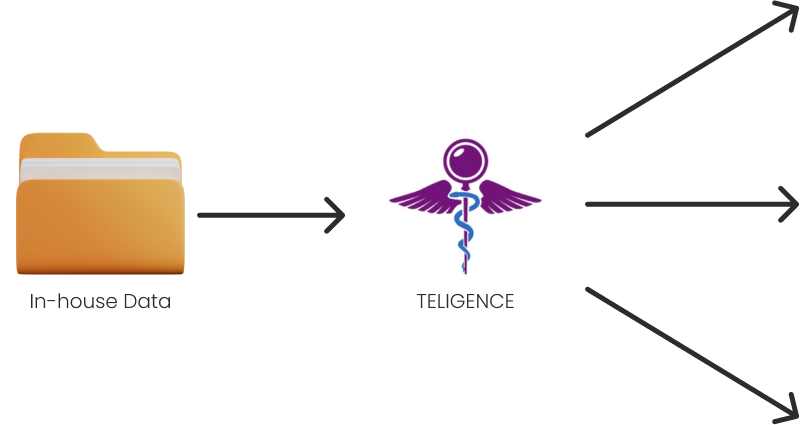
Consistent reporting of KPIs in order to track performance over time
Spur of the moment data pulls and inquiries of the data
Development of visuals for the purpose of presentations to senior leadership
Perfect for adhoc requests, manual data visualization lets you tailor your ouputs as you need them
Ask your data questions in a conversational language, without code. "What is the TRx performance of Amoxicilin in the last 3 weeks?"
Mark your data findings with notes, and export them as a report. Leave a note for your assistant director on a piece of analysis, calling his attention to it
Get text and email alerts when your product's performance needs intervention. ALERT: Rogaine's NBRx has dropped by 3.5% in the last month, action is recommended
View the products performing well, and those with areas of opportunity, at a quick glance. Amoxicilin has increased its TRx by 13% Rogaine's NBRx has decreased by 3.5%